If you want to take a look at the workload (system usage) data of the Automation Engine, you will have a problem: The system overview displays only the last 24 hours. And older data would often be very useful for analyses and statistics.
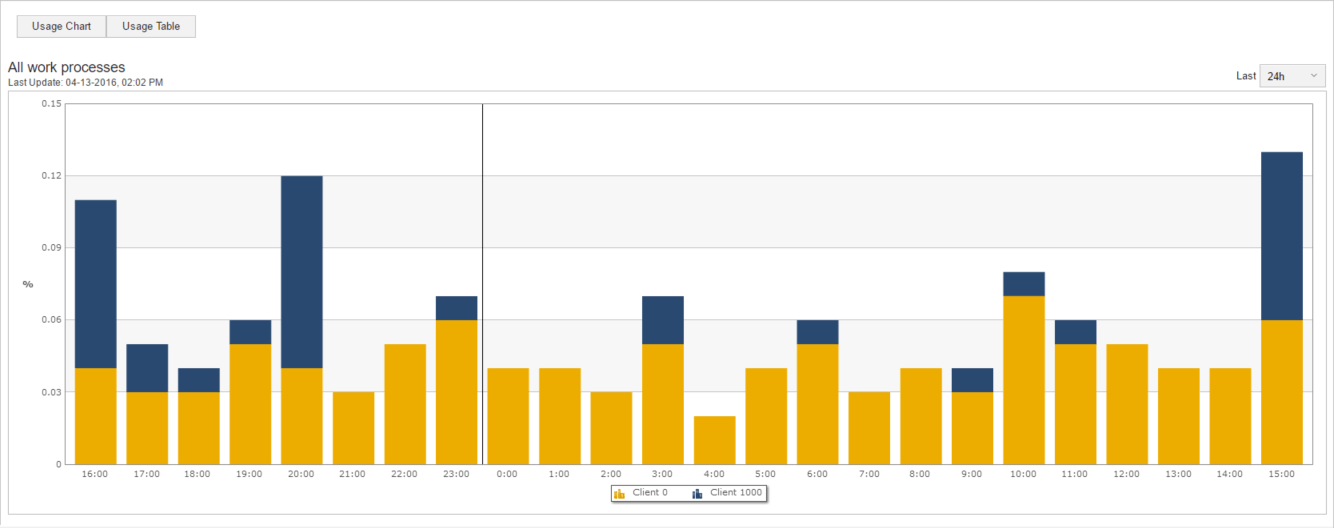
Workload data in the user interface (only last 24h).
That’s why AE users always ask me: Where in the database can I find the historic workload (system usage) values?
And I have to give the disappointing answer: Nowhere. This data is not available in the database.
Luckily, there are functions in script language with which you can find the data. I want to show you a method to collect the data elegantly.
The relevant script functions
The Automation Engine offers four functions for querying the workload (system usage). The links point to the public documentation of AE Version 11.2.
SYS_BUSY_01() – returns the average workload (system usage) of an Automation Engine process during the last minute.
SYS_BUSY_10() – returns the average workload (system usage) of an Automation Engine process during the last 10 minutes.
SYS_BUSY_60() – returns the average workload (system usage) of an Automation Engine process during the last hour.
SYS_INFO( […] ) – reads the system information.
For our example, we will use the first three functions and the last function with the arguments:
SYS_INFO(Message queue, COUNT)
We are interested in the following three message queues:
- MQPWP (message queue of the primary work process)
- MQWP (message queue of the work processes)
- MQDWP (message queue of the dialog processes)
You can find detailed information regarding the functions under the documentation links.
How to use the Archive Values
Sure, we could now create a VARA or similar data container and save the data there at regular intervals. However, that would be cumbersome and inefficient. Therefore, I am reverting to a little trick: I use the Archive Values.
AV (short for Archive Values) is the name of a table in the AE database. It exists since AE Version 9, and the values of each historic run of your objects from PromptSet variables and Object variables are stored there.
That is pretty nifty: We can simply write the workload (system usage) values at regular intervals as object variables and then read them in the AV table.
In other words, we are creating an SCRI object which runs regularly and saves the value as object variables.
SCRI-Object to store the data
With the above function you are creating a simple SCRI object which you run regularly:
:PSET &LOAD_01# = SYS_BUSY_01()
:PSET &LOAD_10# = SYS_BUSY_10()
:PSET &LOAD_60# = SYS_BUSY_60()
:PSET &COUNT_PWP# = SYS_INFO(MQPWP,COUNT)
:PSET &COUNT_WP# = SYS_INFO(MQWP,COUNT)
:PSET &COUNT_DWP# = SYS_INFO(MQDWP,COUNT)
The object saves the workload (system usage) data of the last 1, 10 and 60 minutes and additionally the number of reports in MQPWP, MQWP and MQDWP.
Run this SCRI object periodically, for instance, every 10 minutes. The data is saved automatically in the AV table, and you can access it via SQL.
Accessing the AV Table Data via SQL
The AV table contains the variable name and value of all object variables for each runID. In the AH table (Archive Header) you will find the objectname, runID, and the timestamp (and much more useful information).
In the following SQL script we use the SELECT statement and select with “INNER JOIN” all rows of Table AH, for which the runID is also in the AV table. Then we search for the values timestamp, variablename and value.
Attention: The timestamps are in UTC!
Naturally, only the values from the SCRI object created above and for the desired client are of interest to us. So, remember to adjust AH_CLIENT and AH_NAME accordingly in the script. We will sort the result according to the timestamp.
select AH_TIMESTAMP1, AV_VName, AV_Value
from AH
inner join AV on AH_IDNR = AV_AH_Idnr
--!Modify Client and SCRI-Name according to your system!
where AH_CLIENT = 1
and AH_NAME = 'SCRI_WORKLOAD'
order by AH_TIMESTAMP1;
The results of the scripts after two runs of the SCRI object could look something like this:
| AH_TIMESTAMP1 | AV_VName | AV_Value |
|---|---|---|
| 2016-01-19 16:01:57.000 | &COUNT_DWP# | 0 |
| 2016-01-19 16:01:57.000 | &COUNT_PWP# | 1 |
| 2016-01-19 16:01:57.000 | &COUNT_WP# | 18 |
| 2016-01-19 16:01:57.000 | &LOAD_01# | 15 |
| 2016-01-19 16:01:57.000 | &LOAD_10# | 11 |
| 2016-01-19 16:01:57.000 | &LOAD_60# | 15 |
| 2016-01-19 16:02:07.000 | &COUNT_DWP# | 1 |
| 2016-01-19 16:02:07.000 | &COUNT_PWP# | 1 |
| 2016-01-19 16:02:07.000 | &COUNT_WP# | 21 |
| 2016-01-19 16:02:07.000 | &LOAD_01# | 8 |
| 2016-01-19 16:02:07.000 | &LOAD_10# | 4 |
| 2016-01-19 16:02:07.000 | &LOAD_60# | 4 |
Visualization of the Data in Excel
Just like all professional reporting tools, Excel can read data per SQL directly from the ODBC source. With that, one can very quickly create small visualizations.
For an attractive display, we will rewrite our SQL query a little. Each row of the following SQL codes result is a moment in time with timestamp, and each column is one of six variables.
select AH_TIMESTAMP1,
MAX(CASE AV_VName WHEN '&LOAD_01#' THEN AV_Value END) as 'LOAD_01',
MAX(CASE AV_VName WHEN '&LOAD_10#' THEN AV_Value END) as 'LOAD_10',
MAX(CASE AV_VName WHEN '&LOAD_60#' THEN AV_Value END) as 'LOAD_60',
MAX(CASE AV_VName WHEN '&COUNT_DWP#' THEN AV_Value END) as 'COUNT_DWP',
MAX(CASE AV_VName WHEN '&COUNT_PWP#' THEN AV_Value END) as 'COUNT_PWP',
MAX(CASE AV_VName WHEN '&COUNT_WP#' THEN AV_Value END) as 'COUNT_WP'
from AH
inner join AV on AH_IDNR = AV_AH_Idnr
--!Modify Client and Name according to your system!
where AH_CLIENT = 1
and AH_NAME = 'SCRI_WORKLOAD'
group by AH_TIMESTAMP1
order by AH_TIMESTAMP1;
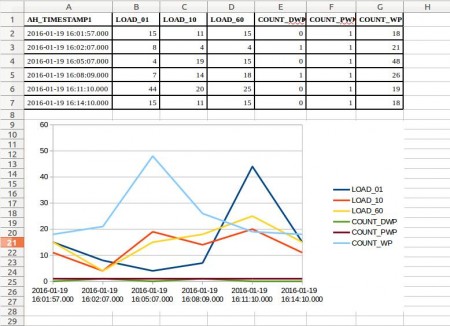
I will dispense with a detailed explanation of the scripts here; the tables and fields used are the same as above. The result for six timestamps looks as follows:
| AH_TIMESTAMP1 | LOAD_01 | LOAD_10 | LOAD_60 | COUNT_DWP | COUNT_PWP | COUNT_WP |
| 2016-01-19 16:01:57.000 | 15 | 11 | 15 | 0 | 1 | 18 |
| 2016-01-19 16:02:07.000 | 8 | 4 | 4 | 1 | 1 | 21 |
| 2016-01-19 16:05:07.000 | 4 | 19 | 15 | 0 | 1 | 48 |
| 2016-01-19 16:08:09.000 | 7 | 14 | 18 | 1 | 1 | 26 |
| 2016-01-19 16:11:10.000 | 44 | 20 | 25 | 0 | 1 | 19 |
| 2016-01-19 16:14:10.000 | 15 | 11 | 15 | 0 | 1 | 18 |
In Excel we can now turn this table into a graphic immediately. Simply highlight the table in Excel and select the desired type of graph in the “Charts” area (menu point “Insert”. I have chosen a line graph. The result looks as follows:
Implementation for your System
I hope that you can use my tips and implement them in your system. Unfortunately, you can no longer retrieve historical data with this method. But at least from now on you will be able to easily save and access workload (system usage) information.
If you have been following the old AutomicBlog, you will have noticed this: This article was published there in similar form. Additional old articles will appear here in updated form. However, if you urgently need an old article, take a look at how you can get access to the old posts.