Gastartikel: Wie man Debugging für JWP durchführt – ein Erfahrungsbericht

Ein Gastartikel von Michael Kutswa.

Nachdem wir unsere Automic AE von V10 auf V12 upgegradet hatten, trat bei uns ein Fehler auf: Der Java-based Work Process (JWP) konnte nicht den Suchindex erstellen, weil es ein Objekt mit fehlerhafter XML Dokumentation gab.

Leider half uns die Fehlernachricht im JWP-Log nicht weiter. Sie gab uns keine Informationen darüber, welches Objekt für den Absturz des Index Builder verantwortlich war.

Deshalb entschlossen wir uns, ein Remote Debugging durchzuführen. Wir benutzten dafür das Eclipse Framework.

Vielleicht ist das auch für Sie interessant, deshalb habe ich diese kleine Beschreibung davon erstellt, mit welchen Schritten wir das Problem gelöst haben.

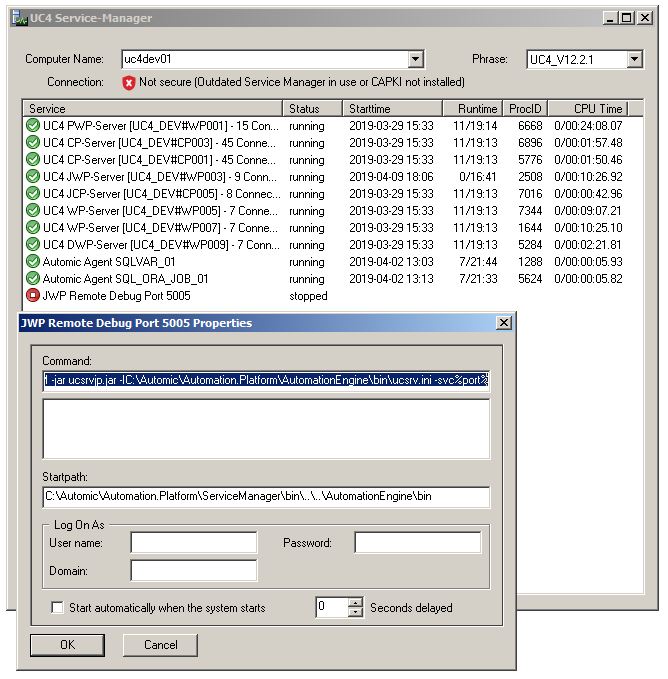
Schritt 1: JWP für das Remote Debugging vorbereiten

Hierfür mussten wir nur einige Parameter für den Start Command im ServiceManager benutzen. Unser Command lautete:

C:\Automic\External.Resources\JDK\jdk1.8.0_144\bin\java -Xdebug -Xnoagent -Djava.compiler=NONE -Xrunjdwp:transport=dt_socket,server=y,suspend=n,address=5005 -Xrs -Xmx512M -jar ucsrvjp.jar -IC:\Automic\Automation.Platform\AutomationEngine\bin\ucsrv.ini -svc%port%

Zusätzlich zu unserem üblichen Command benutzten wir also die folgenden Parameter:

  • -Xdebug
  • -Xnoagent
  • -Djava.comiler=NONE
  • -Xrunjdwp:transport=dt_socket,server=y,suspend=n,address=5005

Der letzte der Parameter braucht einen freien Port als Adresse.

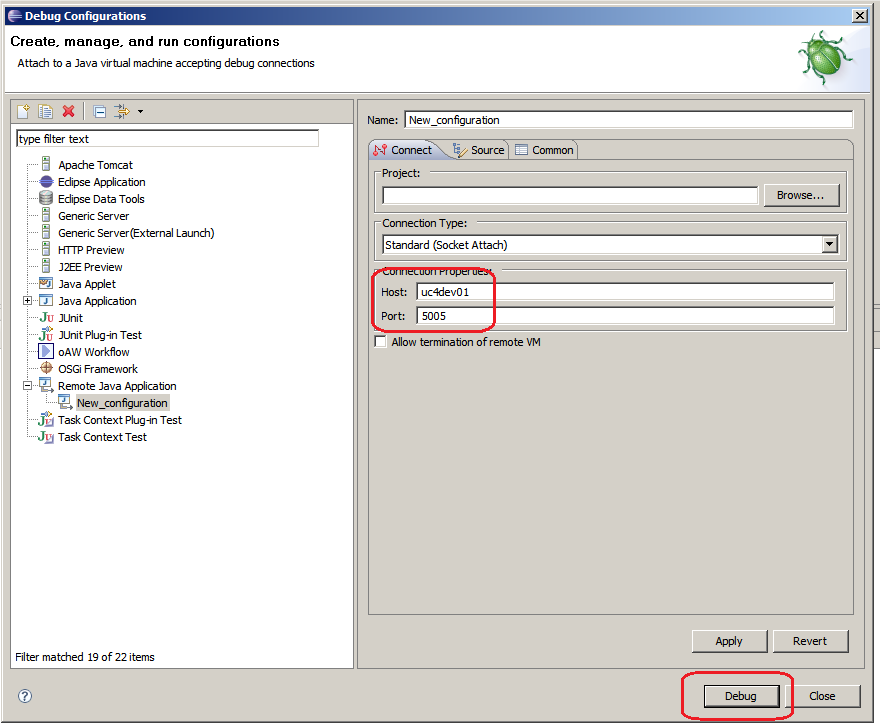
Schritt 2: Debugging starten

Jetzt hielten wir die laufende JWP an und starteten eine neue, um mit dem Remote Debugging loslegen zu können.

In Eclipse erstellten wir eine Debug Configuration für die JWP und starteten das Debugging.

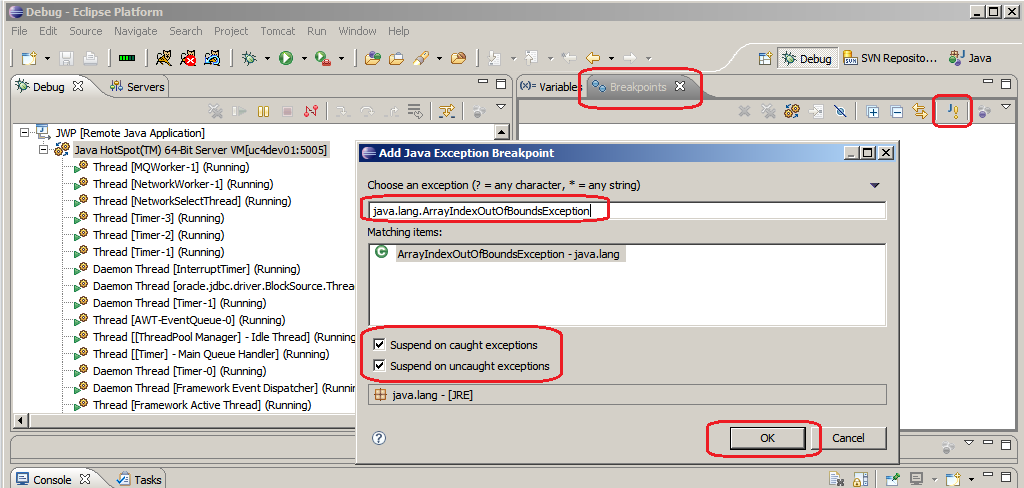
Wir öffneten die Debugging Perspektive und erstellten einen Breakpoint im Moment des Absturzes. Die Bezeichnung der Exception kannten wir aus der Fehlermeldung, deshalb war es einfach, einen Java exception breakpoint zu erstellen.

Jetzt mussten wir nur noch auf die Exception warten, um die objectID herauszufinden.

Schritt 3: Den Übeltäter beseitigen

Durch die objectID konnten wir dann leicht das Objekt in der Datenbank finden. Wir benutzten dafür folgendes SQL Script:

select * from OH where OH_IDNR = 8076260;

Anstatt es zu reparieren haben wir es einfach gelöscht und neu erstellt. Danach funktionierte alles wieder wunderbar und der Search Index konnte erstellt werden.

Beruhigt konnten wir den Debugger vom System trennen, JWP anhalten und wieder normal starten.

Michael Kutswa

Xing

Von |2019-08-13T22:51:16+02:0020. August 2019|Kategorien: AutomicBlog|Kommentare deaktiviert für Gastartikel: Wie man Debugging für JWP durchführt – ein Erfahrungsbericht

Share This Story!

A Guest Post by Michael Kutswa.

After we upgraded our Automic AE from V10 to V12, we encountered an error: The Java-based Work Process (JWP) could not create the search index because there was an object with incorrect XML documentation.

Unfortunately, the error message in the JWP log did not help us any further. It did not tell us which object was responsible for the Index Builder crashing.

So we decided to do remote debugging. We used the Eclipse framework for this.

Maybe that’s interesting for you, too, so I’ve created this little description of how we solved the problem.

Step 1: Preparing JWP for Remote Debugging

For this, we only had to use some parameters for the Start Command in the ServiceManager. Our command was:

C:AutomicExternal.ResourcesJDKjdk1.8.0_144binjava -Xdebug -Xnoagent -Djava.compiler=NONE -Xrunjdwp:transport=dt_socket,server=y,suspend=n,address=5005 -Xrs -Xmx512M -jar ucsrvjp.jar -IC:AutomicAutomation.PlatformAutomationEnginebinucsrv.ini -svc%port%

As you can see, we used the following additional parameters for the command:

  • -Xdebug
  • -Xnoagent
  • -Djava.comiler=NONE
  • -Xrunjdwp:transport=dt_socket,server=y,suspend=n,address=5005

The final parameter needs a free port as address.

Step 3: Starting the Debugging

Now we stopped the running JWP and started a new one to begin with the remote debugging.

In Eclipse, we created a debug configuration for the JWP and started debugging.

We opened the debugging perspective and created a breakpoint at the moment of the crash. We knew the name of the exception from the error message, so it was easy to create a Java exception breakpoint.

Now we just had to wait for the exception to find the objectID.

Step 3: Eliminating the Culprit

With the objectID we could easily find the object in the database. We used the following SQL Script:

select * from OH where OH_IDNR = 8076260;

Instead of fixing it, we just deleted it and rebuilt it. Then, everything worked again and the search index could be created.

Reassured we were able to disconnect the debugger from the system, stop JWP and start again normally.

Michael Kutswa

Xing

Von |2022-06-30T13:05:10+02:0020. August 2019|Kategorien: AutomicBlog|Kommentare deaktiviert für Guest Post: How to Perform a JWP Debugging

Share This Story!

Titel

Nach oben