Measuring System Performance

We all want our Automic systems to run as fast as possible. Therefore, you should perform regular performance measurements.

To test the performance of your Automic system, you have several options.

You probably know one of them: In the administration perspective, you can use the Usage Chart to look at (who would have thought?) the Usage of your system.

Two more possibilities I will present in this article. Both are part of the Automic standard and provide slightly more information than the workload graph.

The Performance Index

Let’s first take a look at the Performance Index.

On the Automic website, you can download a tool to measure performance.

How to install and use the tool is described quite well on the page. That’s why we can get to the exciting part right away: Performance Measurements.

The tool performs activations and measures throughput. In the end, it spits out a single value — the so-called Automic Performance Index. By itself, this value has no special meaning, but it serves as a comparative value.

You can measure your system several times and compare the performance at different times. Is there a trend? Is your system getting better or not?

You can also use the Automic Performance Index to compare different systems.

There are also some reference values from Automic that depend on the number of WPs. Hopefully, your system reaches the appropriate reference value. Or even exceeds it.

On the download page you will also find a graphical overview of reference values as well as anonymous values of other customer systems.

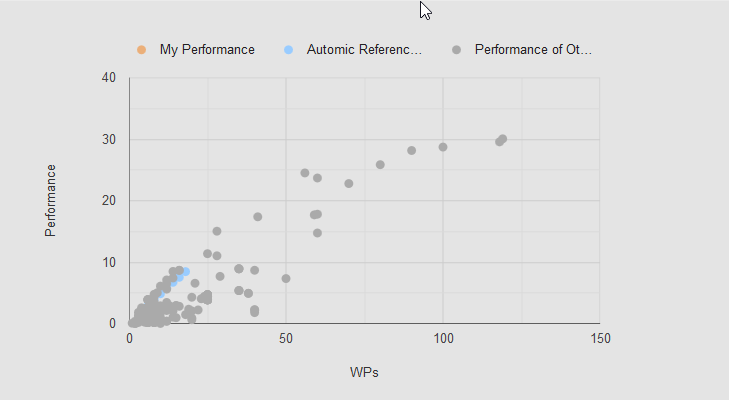
Graph with reference values for the Performance Index(Source: Automic Download Center).

You can see a trend for the blue marked Automic benchmarks: The performance index increases almost linearly with the number of WPs. At least until about 50 WPs, according to this graphic.

Conversely, this means that you can improve system performance by simply increasing the number of WPs — but do so only if you have enough CPU and memory left on your AE servers!

Average Transaction Times

In the documentations sizing guide you can find a section called Transaction Times.

It says that transaction times are an indicator of the performance of the overall system.

There is an example screenshot where you can see a “Avg. Time SR” of “0.0159”.

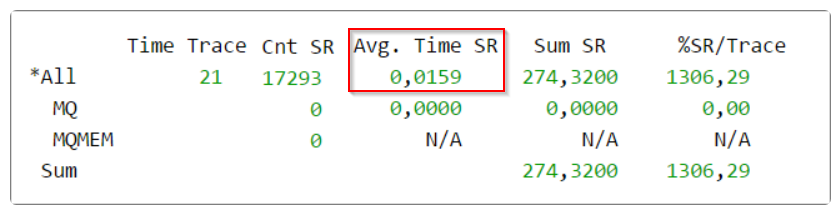
Oh, great, it’s an average. But how do I get it?

The explanation here is probably the least helpful on in all of the (usually very concice) documentation. It describes the following steps:

  1. Turn on minimal trace
  2. Keep trace active for 2 minutes
  3. Collect trace files
  4. Evaluate trace files

Below this you get the extremely useful information that the value should never exceed 0.05. And that at a value over 0.2 means you’re in trouble.

Finally, the section”Troubleshooting” gives you some pointers on where to start if you want to improve your transaction times.

Easy as pie! Or is it?

Not really. Even some of the most experienced Automic cracks out there will have problems with these minimalist statements. How exactly should you evaluate the trace files? And how do you get the average transaction time?

So here’s a little more detailed (and hopefully clearer) description of how to determine the average transaction time of your own system:

  1. Turn on minimal trace
    This should be self-explanatory. If you are new to tracing, I recommend you to learn more about it with an admin training course or some self-study using the Automic Tracing documentation.
  2. Keep trace active for 2 minutes
    This, too, should be self-explanatory.
  3. Collect trace files
    This point has two parts. First, you need to collect the traces from all server nodes and put them in a folder.
    After that, you have to merge all traces into one trace file using the Automic utility AE.LogMix.
    The utility is explained in the documentation.
    The following query, e.g.,  summarizes all lines from the trace files WP*.txt into the file Output.txt in chronological order:

    ucyblgmx -B -LWP*txt -F  Output.txt
  4. Evaluate trace files
    This point is the least clear. How exactly should one “evaluate” this?

Automic cheated a little while creating the sample screenshot: There is an Automic-internal tool that performs the evaluation of the traces.

This tool is called log.exe. Previously you got the tool and an explanation to the Automic training “Admin Advanced”. Unfortunately, I do not know if this training is still available or if the tool is now part of another training — as we all know, things are currently changing a lot at Automic (and in particular Automic Services).

But luckily, you do not need log.exe to get the average time of all server routines from the trace file “Output.txt” (that is “Avg. Time SR”, the “average transaction time”).

In minimal traces, the start and the end of each server routine call are logged. Server routines and subroutines have a hierarchy and are also hierarchically logged.

Lines at the end of the routine begin with “EXIT” and contain the runtime of the routine after “TIME:”.

Screenshot excerpt of Output.txt.
Blue highlighting: JPEXEC_R routine including subroutines.
Red highlighting: Runtime of the routine within the corresponding EXIT line.

To measure the average SR times, we only need the top-level, the subroutines are not interesting to us.

All we have to do is evaluate the lines that contain the string “- EXIT” and then calculate the average of the “TIME:” values from these lines.

This can be done, for example, with the following Powershell code snippet.

Select-String -CaseSensitive "- EXIT " .\Output.txt | Foreach-Object {
     # the angle brackets in the regex create attributes
     # the type attribute is not used in the example
     if ($_ -match "EXIT (?<type>[\w_]+) .*TIME: (?<time>[\d,]+)") {
         # replace comma with dot so it is recognized as decimal number
         $matches.time -replace ",","."
     }
 } |  Measure-Object -Maximum -Minimum -Average


In addition to the average, this also spits out the smallest and the largest value, as well as the number of measured server routines. Thanks for this script, Joel!

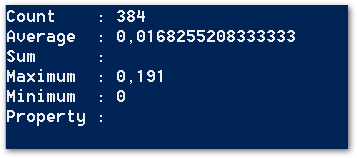
That’t what the output of the script could look like.

I’ve got 384 server routines in the traces. The shortest took 0.0000, the longest 0.191. The average over all transactions was 0.0168 — awesome, that’s a perfect result! 🙂

I wish you success in the performance measurement of your system!

I hope the result is to your taste!

Von |2022-06-30T13:06:01+02:0026. März 2019|Kategorien: AutomicBlog|Kommentare deaktiviert für Measuring System Performance

Share This Story!

Wir alle wollen, dass unsere Automic Systeme so schnell laufen, wie nur möglich. Deshalb sollte man regelmäßig Performance-Messungen durchführen.

Wenn du die Leistung deines Automic Systems testen willst, stehen dir mehrere Möglichkeiten offen.

Eine davon kennst du wahrscheinlich: In der Administrations-Perspektive kannst du dir mit der Auslastungsgrafik die (wer hätte es gedacht?) Auslastung deines Systems ansehen.

Zwei andere Möglichkeiten stelle ich in diesem Artikel vor. Beide gehören zum Automic-Standard und bieten etwas mehr Informationen als die Auslastungsgrafik.

Der Performance Index

Als Erstes werfen wir einen Blick auf den Performance Index.

Auf der Automic-Website kannst du ein Tool zur Performance-Messung herunterladen.

Wie du das Tool installierst und verwendest, wird auf der Seite ganz gut beschrieben. Deshalb kommen wir gleich zum spannenden Teil: der Performance Messung

Das Tool führt Aktivierungen durch und misst den Durchsatz. Am Ende spuckt es dann einen einzelnen Wert aus, den sogenannten Automic Performance Index. Für sich genommen hat dieser Wert keine besondere Bedeutung, aber er dient als Vergleichswert.

Du kannst dein System immer wieder messen und die Performance zu unterschiedlichen Zeitpunkten miteinander vergleichen. Gibt es einen Trend? Wird dein System performanter oder nicht?

Du kannst den Automic Performance Index aber auch verwenden, unterschiedliche Systeme miteinander zu vergleichen.

Außerdem gibt es einige Referenzwerte von Automic, die von der Anzahl an WPs abhängen. Im besten Fall erreicht dein System den passenden Referenzwert. Oder übersteigt ihn sogar.

Auf der Downloadseite findest du auch eine grafische Übersicht über Referenzwerte sowie anonymisierte Werte anderer Kunden-Systeme.

Diagramm mit Referenzwerten für den Performance Index (Quelle: Automic Download Center).

An den blau markierten Automic-Referenzwerten kannst du einen Trend erkennen: Der Performance Index steigt fast linear mit er Anzahl an WPs. Zumindest bis ca. 50 WPs ist das laut dieser Grafik so.

Das bedeutet im Umkehrschluss, dass du die Systemperformance verbessern kannst, indem du einfach die Anzahl an WPs  erhöhst – mache das aber nur, wenn noch ausreichend CPU-Kapazitäten und Speicher auf deinen AE-Servern frei sind!

Durchschnittliche Transaktionszeiten

Im Sizing-Guide der Dokumentation findest du einen Bereich über “Transaction Times”.

Dort steht, dass Transaktionszeiten ein Indikator für die Performance des Gesamt-Systems sind.

Es gibt dort einen Beispiel-Screenshot wo eine “Avg. Time SR” von “0,0159” zu erkennen ist.

Oh, ein Durchschnittswert. Aber wie bekommt man den eigentlich?

Der Begleittext zu dieser Info ist wahrscheinlich einer der am wenigsten hilfreichen in der gesamten – und normalerweise doch wirklich sehr guten – Dokumentation. Dort steht, dass man die folgenden Schritte durchführen soll:

  1. Minimal Trace aufdrehen
  2. Tracing für 2 Minuten aktiviert lassen
  3. Trace-Files zusammensammeln
  4. Trace-Files Auswerten

Darunter erhält man dann noch die außerordentlich nützliche Information, dass der Wert nicht mehr als 0,05 betragen sollte. Und dass bei einem Wert über 0,2 so richtig Feuer am Dach ist.

Im Abschnitt “Troubleshooting” stehen dann noch ein paar Hinweise, wo man ansetzen kann, um die Transaktions-Zeiten zu verbessern.

Alles klar! Oder?

Wahrscheinlich nicht. Denn selbst einige der erfahrensten Automic-Cracks da draußen kommen mit dieser minimalistischen Anweisung nicht zurecht. Wie genau soll man die Trace-Files auswerten? Und wie kommt man an die durchschnittliche Transaktions-Zeit?

Hier deshalb für euch meine etwas detailliertere (und hoffentlich verständlichere) Beschreibung, wie man die durchschnittliche Transaktions-Laufzeit des eigenen Systems ermittelt:

  1. Minimal Trace aufdrehen
    Dieser Punkt sollte selbsterklärend sein. Wenn du dich mit Tracing noch nicht gut auskennst, empfehle ich dir den Besuch einer Admin-Schulung oder alternativ ein Selbst-Studium mithilfe der Automic Dokumentation zum Thema Tracing.
  2.  Tracing für ca. 2 Minuten aktiviert lassen.
    Auch das sollte noch klar sein.
  3. Trace-Files zusammensammeln.
    Dieser Punkt hat zwei Teilschritte. Zunächst musst du die Traces von allen Server-Nodes sammeln und in einen Ordner irgendwo gemeinsam ablegen.
    Danach musst du die Traces noch mithilfe des Automic Dienstprogramms AE.LogMix zu einem Gesamt-Tracefile zusammenführen.
    Das Utility ist in der Doku erklärt. Der folgende Aufruf zum Beispiel fasst alle Zeilen aus den Tracefiles WP*.txt in die Datei Output.txt chronologisch zusammen:

    ucyblgmx -B -LWP*txt -FOutput.txt
  4. Trace-Files auswerten
    Dieser Punkt ist am wenigsten klar. Wie genau soll man das “auswerten”?

Automic hat beim Erstellen des Beispiel-Screenshots ein wenig geschummelt: Es gibt ein Automic-internes Tool, dass die Auswertung der Traces durchführt.

Dieses Tool heißt log.exe. Früher bekam man das Tool und eine Erklärung dazu beim Automic-Training “Admin Advanced”. Ob es dieses Training noch gibt oder das Tool nun Teil eines anderen Trainings ist, weiß ich leider nicht, da sich derzeit bei Automic (und insbesondere bei Automic Services) alles im Wandel befindet.

Du brauchst log.exe aber nicht, wenn du einfach nur aus dem Gesamt-Tracefile “Output.txt” die durchschnittliche Zeit aller Server-Routinen willst (das ist diese “Avg. Time SR”, d. h. die „durchschnittliche Transaktions-Zeit“).

In den Minimal-Traces wird der Start und das Ende jedes Server-Routinen-Aufrufs mitgeloggt. Server-Routinen und Subroutinen haben eine Hierarchie und werden auch hierarchisch geloggt.

Zeilen zum Ende der Routine beginnen mit “EXIT” und enthalten hinter “TIME:” die Laufzeit der Routine.

Screenshot Auszug aus Output.txt.
Blau hervorgehoben: Eine JPEXEC_R Routine inklusive Subroutinen.
Rot hervorgehoben: Die Laufzeit der Routine in der dazugehörigen EXIT-Zeile.

Um die durchschnittlichen SR Zeiten zu messen, brauchen wir nur die oberste Ebene, die Subroutinen interessieren uns nicht.

Wir müssen also nur die Zeilen auswerten, die den String “- EXIT” enthalten, und dann von diesen Zeilen den Durchschnitt der “TIME:”-Werte berechnen.

Das geht zum Beispiel mit folgendem Powershell-Codeschnippsel.

Select-String -CaseSensitive "- EXIT " .\Output.txt | Foreach-Object {
     # die spitzen Klammern in der regex legen Attribute an
     # das type-Attribut wird bei dem Beispiel aber nicht verwendet
     if ($_ -match "EXIT (?<type>[\w_]+) .*TIME: (?<time>[\d,]+)") {
         # ersetzt Komma durch Punkt, damit es als Dezimalzahl erkannt wird
         $matches.time -replace ",","."
     }
 } |  Measure-Object -Maximum -Minimum -Average

Zusätzlich zum Durchschnitt spuckt uns das auch noch den kleinsten und den größten Wert aus, sowie die Anzahl der gemessenen Server-Routinen. Vielen Dank für dieses Skript, Joel!

So könnte der Output des Skripts aussehen.

Ich habe 384 Server-Routinen in den Traces. Die kürzeste hat 0,0000 gedauert, die längste 0,191. Der Durchschnitt über alle Transaktionen war 0,0168 – Glück gehabt, das ist ein perfektes Ergebnis! 🙂

Damit wünsche ich dir auch viel Erfolg bei der Performance-Messung deines Systems!

Ich hoffe, das Ergebnis deiner Messung ist nach deinem Geschmack!

Von |2019-03-26T10:01:04+01:0026. März 2019|Kategorien: AutomicBlog|Kommentare deaktiviert für System Performance Messen

Share This Story!

Titel

Nach oben