We all want our Automic systems to run as fast as possible. Therefore, you should perform regular performance measurements.
To test the performance of your Automic system, you have several options.
You probably know one of them: In the administration perspective, you can use the Usage Chart to look at (who would have thought?) the Usage of your system.
Two more possibilities I will present in this article. Both are part of the Automic standard and provide slightly more information than the workload graph.
The Performance Index
Let’s first take a look at the Performance Index.
On the Automic website, you can download a tool to measure performance.
How to install and use the tool is described quite well on the page. That’s why we can get to the exciting part right away: Performance Measurements.
The tool performs activations and measures throughput. In the end, it spits out a single value — the so-called Automic Performance Index. By itself, this value has no special meaning, but it serves as a comparative value.
You can measure your system several times and compare the performance at different times. Is there a trend? Is your system getting better or not?
You can also use the Automic Performance Index to compare different systems.
There are also some reference values from Automic that depend on the number of WPs. Hopefully, your system reaches the appropriate reference value. Or even exceeds it.
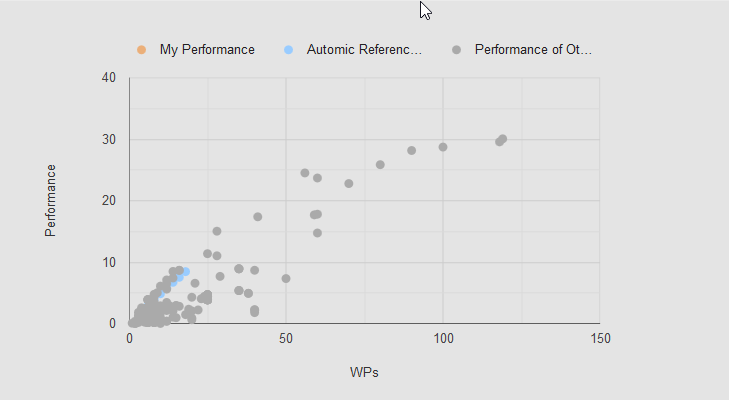
On the download page you will also find a graphical overview of reference values as well as anonymous values of other customer systems.

Graph with reference values for the Performance Index(Source: Automic Download Center).
You can see a trend for the blue marked Automic benchmarks: The performance index increases almost linearly with the number of WPs. At least until about 50 WPs, according to this graphic.
Conversely, this means that you can improve system performance by simply increasing the number of WPs — but do so only if you have enough CPU and memory left on your AE servers!
Average Transaction Times
In the documentations sizing guide you can find a section called Transaction Times.
It says that transaction times are an indicator of the performance of the overall system.
There is an example screenshot where you can see a “Avg. Time SR” of “0.0159”.
The explanation here is probably the least helpful on in all of the (usually very concice) documentation. It describes the following steps:
- Turn on minimal trace
- Keep trace active for 2 minutes
- Collect trace files
- Evaluate trace files
Below this you get the extremely useful information that the value should never exceed 0.05. And that at a value over 0.2 means you’re in trouble.
Finally, the section”Troubleshooting” gives you some pointers on where to start if you want to improve your transaction times.
Easy as pie! Or is it?
Not really. Even some of the most experienced Automic cracks out there will have problems with these minimalist statements. How exactly should you evaluate the trace files? And how do you get the average transaction time?
So here’s a little more detailed (and hopefully clearer) description of how to determine the average transaction time of your own system:
- Turn on minimal trace
This should be self-explanatory. If you are new to tracing, I recommend you to learn more about it with an admin training course or some self-study using the Automic Tracing documentation. - Keep trace active for 2 minutes
This, too, should be self-explanatory. - Collect trace files
This point has two parts. First, you need to collect the traces from all server nodes and put them in a folder.
After that, you have to merge all traces into one trace file using the Automic utility AE.LogMix.
The utility is explained in the documentation.
The following query, e.g., summarizes all lines from the trace files WP*.txt into the file Output.txt in chronological order:ucyblgmx -B -LWP*txt -F Output.txt
- Evaluate trace files
This point is the least clear. How exactly should one “evaluate” this?
Automic cheated a little while creating the sample screenshot: There is an Automic-internal tool that performs the evaluation of the traces.
This tool is called log.exe. Previously you got the tool and an explanation to the Automic training “Admin Advanced”. Unfortunately, I do not know if this training is still available or if the tool is now part of another training — as we all know, things are currently changing a lot at Automic (and in particular Automic Services).
But luckily, you do not need log.exe to get the average time of all server routines from the trace file “Output.txt” (that is “Avg. Time SR”, the “average transaction time”).
In minimal traces, the start and the end of each server routine call are logged. Server routines and subroutines have a hierarchy and are also hierarchically logged.
Lines at the end of the routine begin with “EXIT” and contain the runtime of the routine after “TIME:”.
To measure the average SR times, we only need the top-level, the subroutines are not interesting to us.
All we have to do is evaluate the lines that contain the string “- EXIT” and then calculate the average of the “TIME:” values from these lines.
This can be done, for example, with the following Powershell code snippet.
Select-String -CaseSensitive "- EXIT " .\Output.txt | Foreach-Object | Measure-Object -Maximum -Minimum -Average
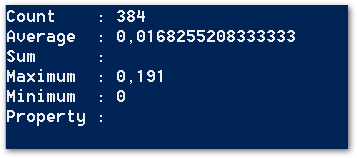
In addition to the average, this also spits out the smallest and the largest value, as well as the number of measured server routines. Thanks for this script, Joel!
I’ve got 384 server routines in the traces. The shortest took 0.0000, the longest 0.191. The average over all transactions was 0.0168 — awesome, that’s a perfect result! 🙂
I wish you success in the performance measurement of your system!
I hope the result is to your taste!


