Two weeks ago, Joel Wiesmann introduced his Tool Workflow Visio(n) for the visualization of workflows here in this blog.
When I first heard about this tool, I was quite enthusiastic about it. Joel demonstrated it to me personally and had me convinced of its usefulness right away.
That made me think immediately about another user application: The visualization of the critical path. I’ve dealt with this subject previously in 2014 in my former AutomicBlog article on how to find the critical path of a workflow via SQL.
Below a brief summary of how that works, and how to visualize the critical path with Joel’s Visio Tool.
The Critical Path of a Workflow
Normally, a workflow has several sequences of tasks. For example, in this screenshot you can see a simple workflow with three paths.

The paths are:
- 1 -> 2 -> 5 > 6
- 1 -> 3 -> 6
- 1 -> 4 -> 6
Most of the time, the path with the longest runtime is referred to as the critical path. For a workflow object, this means: The path whose tasks add up to the longest estimated runtime.
So, which path in this example is the critical path?
To find out, you need first of all a recursive database query. It finds the paths of a workflow and already contains the estimated runtime of all tasks.
Pay attention when copying the code: You need to add the client number and the name of your workflow on lines 15 and 16.
I’m not going to deal with the script here. If you have questions, just send me a comment. In any case, the query results in a table with all paths of the workflow. It lists the client, the name of the workflow, the path and the sum of the expected runtime.
For the example shown in the above screenshot, the table looks as follows:
| Client | Wflowname | Path | Ertsum |
|---|---|---|---|
| 1000 | JOBP.002 | 1.3.6 | 1 |
| 1000 | JOBP.002 | 1.4.6 | 1 |
| 1000 | JOBP.002 | 1.2.5.6 | 120 |
Therefore, the critical path is quite clear 1→2→5→6.
Complex Workflows Can be Confusing
For small workflows, as shown in the above example, a separate visualization of the critical path is hardly worthwhile. There are not many paths, and everything is quite easily seen.
It looks quite different when we are dealing with complex workflows.

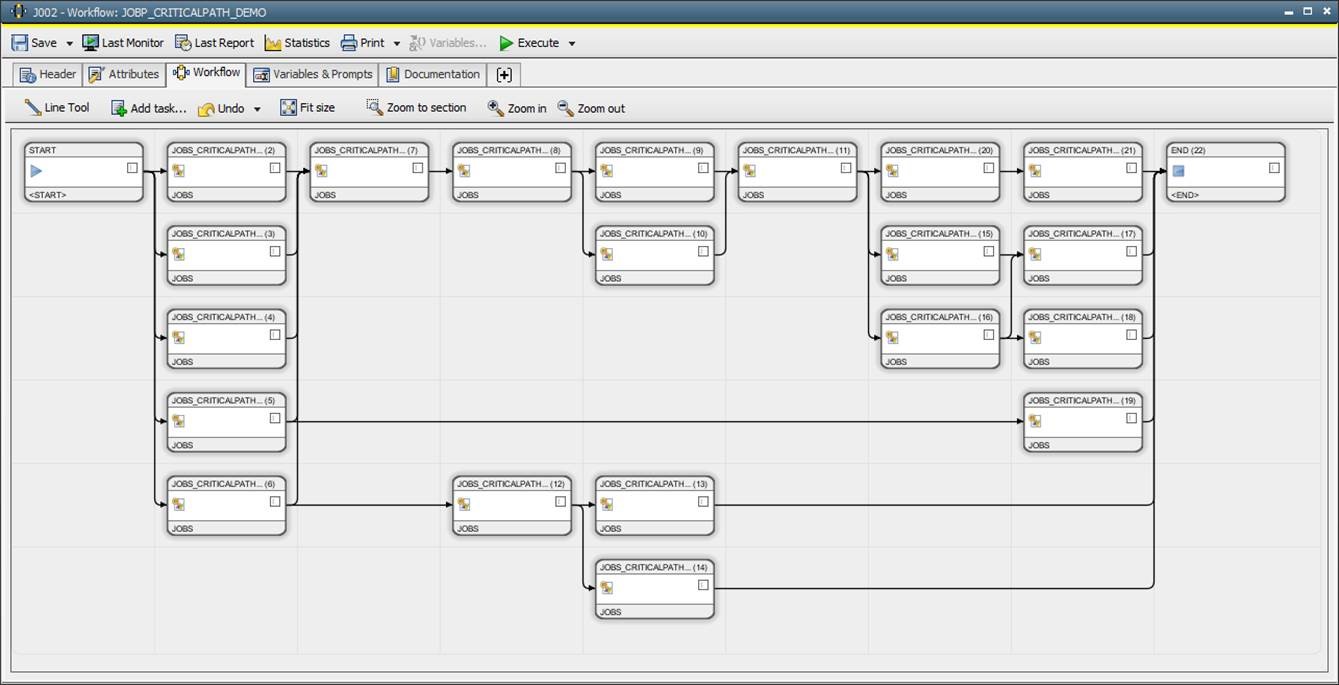
The following workflow is also still quite benign, but it already has 43 different paths. Count them if you like.
With the above script, you can discover the critical path. The path is 1.6.7.8.10.11.16.17.22 .
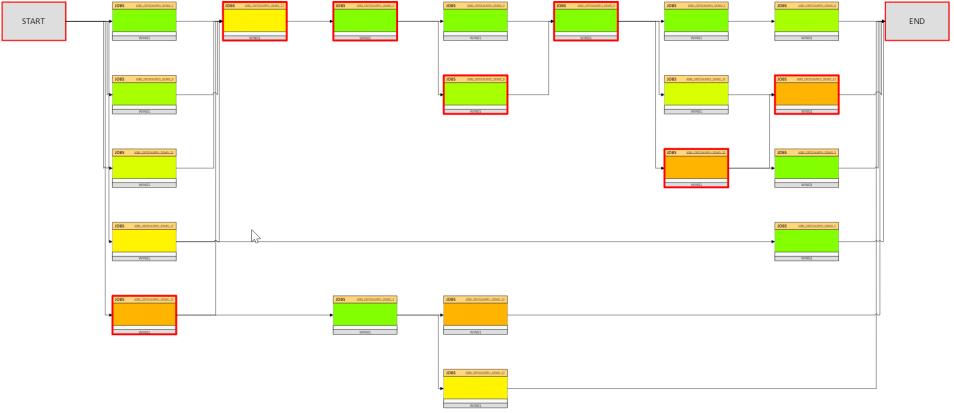
Can you see it as first glance? In this case, a visualization makes a lot more sense and prevents your having to search each time.
Illustration with the Visio Tool
Joel has already explained everything in detail. His tool needs two files as input.
- csvRelDataFile
A CSV file with one entry per relation between two tasks. Workflow Visio() makes available SQL scripts for creating this file for a few typical user applications. - csvTaskDataFile
A CSV file with one entry per workflow task. This file must contain at least the lnr, the type, and the X and Y coordinates for each task. Additional fields are optionally possible; for example, name, description or highlight.
You can find detailed information in Joel’s guest article.
For my example, I simply created the csvRelDataFile with the available script oracle_nonrecursive_oh-rel.sql. The table has 32 lines, one for each relation between two tasks. I named the file criticalpath_rel.csv.
No template exists for the csvTaskDataFile, and I had to write it myself. Joel’s example HeatData (oracle_nonrecursive_oh-task_default_or_heatmap.sql) already contains many useful fields and is a good starting point. It contains the following fields:
LNR: The JPP_LNR of the task within the workflow
OBJECTNAME: Name of the Object
NAME: Alias name des Object in case one has been defined. Otherwise the Object Name
TYPE: Object Type
Y: Y-Coordinate for the Position within the Workflow
X: X-Coordinate for the Position within the Workflow
ACTIVE: Is the Task in the Workflow active?
DESCRIPTION: The Object Title as a description
ERT: The “Estimated Runtime” of the Object in seconds (OH_ERT)
AGENT: Agent on which the job runs (i.e., Src and Dst Agent for Filetransfers)
HEATDATA: The “Estimated Runtime” of the Object in the “HH:MM:SS” format
HEAT: A percentage value calculated in HEATDATA for the Heatmap Illustration with traffic lights. The lower the value, the greener the task illustration. The higher the value, the redder the task illustration.
All this is already quite useful, but for us the most important information is missing: Does the task belong in the critical path? Therefore, I have adapted the script and included my above-mentioned query. The result now shows an additional field:
HIGHLIGHT: Possible values: 0 or 1. Tasks with “1” are emphasized, i.e., outlined in red, tasks with “0” are not.
Highlight then has the value of 1 if the task is in the critical path.
Here is my adapted script (for Oracle only. Sorry!).
I save the result in a file called criticalpath_task.csv. This gives me all needed files, and I can activate WorkflowVision(s):
powershell.exe -ExecutionPolicy Bypass .\workflowVision.ps1 -csvTaskDataFile .\criticalpath_task.csv -csvRelDataFile .\criticalpath_rel.csv -outputFile .\criticalpath.svg
As you can see, I have chosen SVG as an output format.

The Heatmap colors the tasks in accordance with their estimated runtime. The “redder” a task, the longer it runs.
Through my script adaptation all tasks in the critical path are outlined in red. Useful, isn’t it?
Are you using Workflow Visio(n) yet?
I think Joel’s tool is simply cool. And it’s great that he invested the effort to publish it and make it available at no charge. Thanks so much, Joel!
Have you used Workflow Visio(n) yet, or do you have a fantastic idea of what else can be done with it? Just email me or send me a comment. I’ll be happy to introduce your idea here in this blog.
