Over the last few weeks I have already presented my general impressions of the V12.2 and looked in detail at the changes in the AWI.
Today, it’s time for the next V12.2 topic off: Analytics, too, has changed a lot.
When Analytics were introduced in V12.0 it was a pure report feature. For AWA it was limited to jobs, workflows and service level fulfillment.
In V12.1, the analytics platform grew and has also been used for Intelligent Automation. Vara-to-Chart added a useful new reporting feature – but a licensed one. Reporting had unfortunately not changed in V12.1 compared to V12.0.
In V12.2, there are several new features.
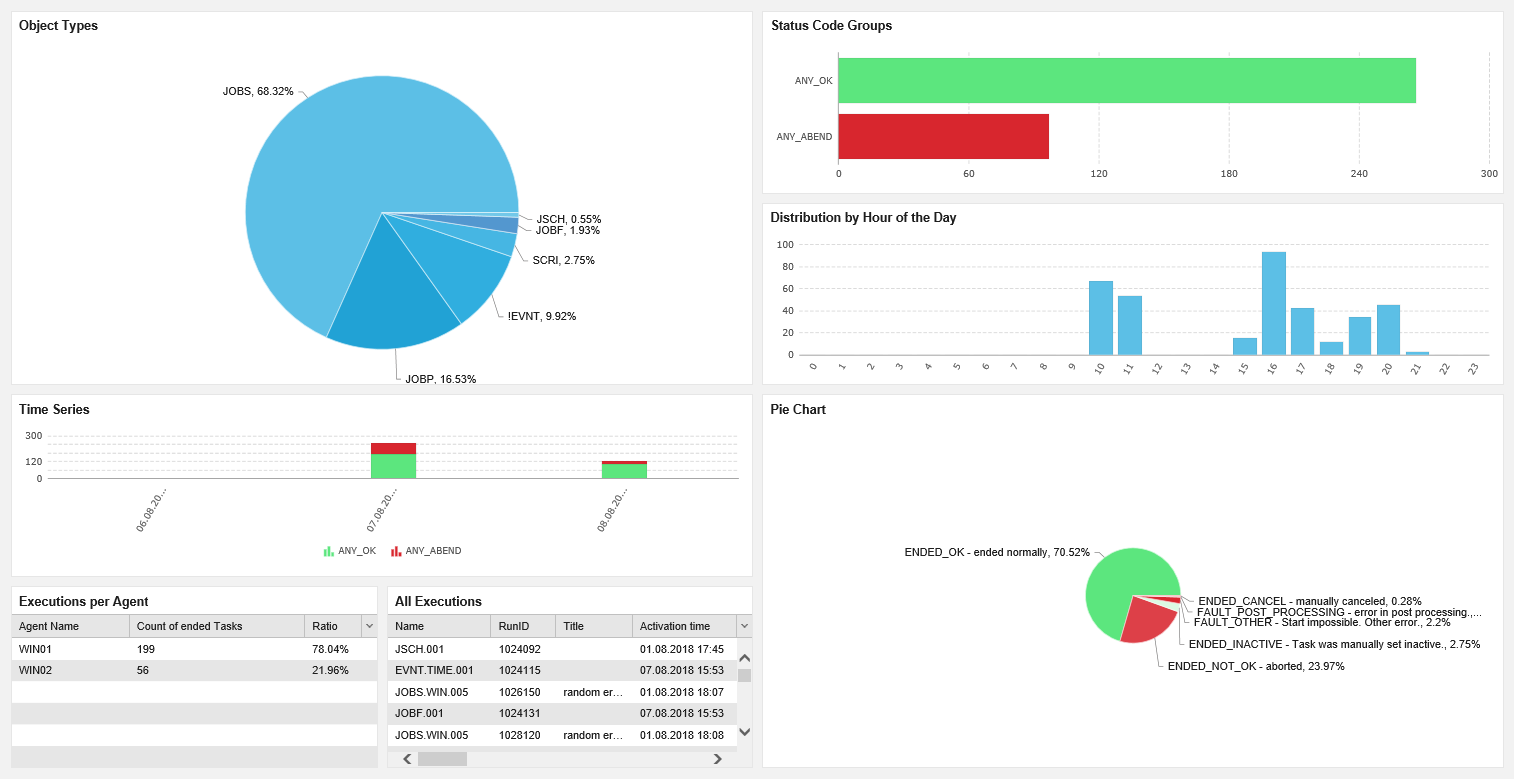
Analytics Reporting in V12.2
Firstly, the reporting feature was finally extended.
In addition to jobs, workflows, and service fulfillment, two more options are now available as data sources: file transfers and tasks.
File transfers are JOBF objects and Tasks are the sum of all executable objects.
Finally, you can analyze all object executions with Analytics, completely independent of the object type.
And you can more accurately report and analyze file transfers. There are now several attributes for file transfers available in Analytics.
In addition to new data sources, there was also an extension of the attributes. The table AH_Cleaned has been extended.
In the first blog post about Analytics (at that time Analytics 1.0 in AE V12.0) you can see which attributes were previously included in AH_Cleaned – and what exactly the table AH_Cleaned is.
In V12.2, AH_Cleaned has been extended with the following attributes:

New attributes in AH_Cleaned.
Some of the fields are only relevant for file transfers, others for all tasks.
Which attributes you see depends on which data source you select in the dashboard:
- Alias and Internal Account are always included.
- Object type is only available for the data source “tasks”.
- For “file transfers” there are also: Number of Files transferred, Source Agent, Source File, Destination Agent, Destination File.
At the moment, some added fields from AH_Cleaned appear to be unused in Analytics (e.g., AH_EventSubType2). I assume they are in preparation for future releases.
Automic deliberately did not enable data cleansing on the staging tables in the Analytics database (AH, LASLM) in V12.0 and V12.1. Because the old data will be used for a new transfer to the “Cleaned” tables, as soon as the cleaned tables get more columns. Now, in V12.2, the Cleaned tables got new columns. I haven’t checked whether old entries from the staging area are transferred.
But data cleansing of the staging tables is not yet included in V12.2.0 – neither in the backend process nor in Analytics Action Pack.
So keep an eye on your staging tables if you use Analytics! They will continue to grow forever if you don’t interfere manually!
Awesome: Finally, you can evaluate statistic of all objecct types, not just JOBS and JOBP!
New Widget: VARA to Grid
In addition to the enhancements for Analytics Reporting, there is also a new Analytics widget in V12.2: VARA-to-grid.
It is the official replacement for the cockpit object (CPIT), which is not supported in the AWI. CPIT has the main ability to change the design depending on the values - for example, to change the color from green to red as soon as a certain threshold is reached. That’s exactly what VARA-to-grid does.
You set the data source directly at the widget. Unfortunately, only static variable objects are supported here, not dynamic ones. This was also the case for CPIT objects. The VARAs that you used in your Cockpits can be re-used for VARA-to-Grid.
For each VARA entry, the widget then displays a grid entry.
In the grid configuration of the widget, you can then configure the color assignment: You can set the colors of values for different limits.
Like all Analytics widget types, VARA-to-Grid is only available when the optional Analytics WebUI plugin, the Analytics backend and the datastore are installed. Therefore, I assume that when upgrading to V12.2, VARA-to-grid widgets will not automatically be created for all existing CPIT objects.
A very simple widget, but quite useful!
Here is the link to the documentation: Vara to Grid Widget.
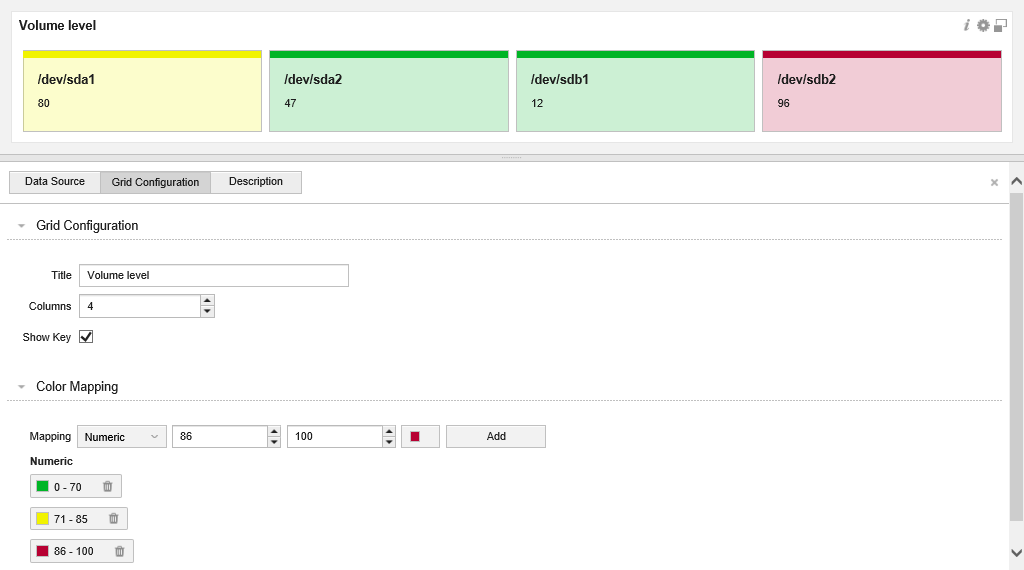
Simple configuration and nice appearance – does what it’s supposed to!
Summary
It’s great that some things have changed in Analytics!
The enhancements to reporting seem subtle, but increase the usefulness of the feature enormously! Finally, you can create reports on all his tasks – and, in my view, the feature is now more than an MVP.
The CPIT object never was one of my favorite object types. But there are of course customers who use it. Therefore, it was a bit surprising that no corresponding solution was implemented in the AWI.
Now it will be replaced by its own widget type. A great solution – because the VARA-to-grid Widget looks a worlds better than the old CPITs!
Have you already tested the analytics in V12.2? What is your impression of it?